 Premier Pop C Pop Culture News – Movies, Comics, Television, Books, Toys, Games, and More
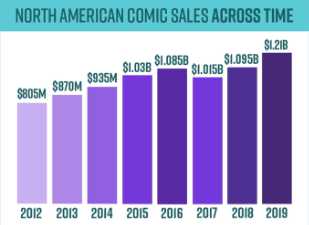
Comics and graphic novel sales topped $1.2 billion in 2019, according to a new joint estimate by Comichron’s John Jackson Miller and ICv2’s Milton Griepp. Total comics and graphic novel sales to consumers in the U.S. and Canada were approximately $1.21 billion in 2019, an 11% increase over sales in 2018. The increase was due to continued rapid gains in graphic novel sales in the book channel and single digit growth in sales of periodical comics in comic stores.
“Print comics sales had never before topped $1 billion in current dollars, and one has to go back to the boom of the early 1990s to find sales at or above that level when adjusted for inflation.” Miller said of the new estimate.
“The massive shift to graphic novels as the preferred format for comics continued in 2019,” Griepp said, “bringing sales in the book channel above the comic store channel in North America for the first time in the history of the medium.”
Sales of kids graphic novels in the book channel, which includes chain bookstores, mass merchants, major online retailers, and Scholastic Book Fairs were once again driving the format. Digital sales were back to 2018 levels as the growth in catalogue titles across major platforms slowed. Sales of periodical comics in comic stores were up mid-single digits.
The pair also commented on the challenging environment for comics and graphic novel sales in the COVID era. “Demand for comics content remains high,” Griepp noted, “and retailers have been finding inventive ways to fill that demand.”
“The comics industry has displayed resilience during many difficult times over the decades,” Miller said. “While the pandemic may prove its biggest test yet, 2019 provided the business with a strong base.”
The analysts made two changes in methodology that affected estimates for 2019. First, they began including an estimate of graphic novels sold by comic stores from sources other than Diamond Comic Distributors; past estimates had assumed that sales of graphic novels by Diamond Comic Distributors accounted for nearly all of the graphic novels sold by comic stores. Second, they refined their estimate of Diamond’s North American sales to account for comics shipped from North America to locations beyond the continent, reducing the estimates of sales by North American comic stores accordingly. To some extent, these two changes in methodology offset.
As presented above and in the accompanying infographics, the analysis by Comichron and ICv2 was divided up between periodical comics (what some call “floppies” or “pamphlets”), graphic novels, and digital download-to-own sales. All print figures are calculated based on the full retail price of books sold into the market, and do not account for discounting or markup. Digital sales do not include subscription-based “all you can read” services.
The “Other” channel in our channel breakdown includes the Newsstand (periodical sales through specialty retail and mass merchant chains) and Crowdfunding (Kickstarter, etc.) channels. This year, those two channels each accounted for roughly half of the “Other” category.
Sources for the information include NPD BookScan, which collects weekly point-of-sale data on print books from over 16,000 locations including e-tailers, chains, mass merchandisers, independent bookstores, and more. NPD BookScan covers approximately 85% of the U.S. trade print book market. Some publishers classify titles that are primarily text, or art books, as graphic novels; those titles are removed from the analysis. The analysis also incorporates information released by Diamond Comic Distributors, the largest distributor of English-language comics and graphic novels in the world, on sales to comic stores.
Information is also gathered from a variety of other sources, including publisher, distributor, and retailer interviews.
This is the seventh joint market size analysis from ICv2 and Comichron; the first was for 2013 sales.